Cell Types Reference
Notebooks support 14 cell types. Each cell has a name (unique within the notebook), a type, and a layout controlling its display height and collapsed state.
Data cells (table, chart, log, etc.) execute SQL queries and register their results in the local WASM query engine, making them available for downstream cells to query.
Every query-backed cell type below also accepts an optional timeRange: { from, to } field — a per-cell override of the notebook's global time range. See Per-Cell Query Time Range for details; it isn't repeated in each cell type's field table below.
 Chart
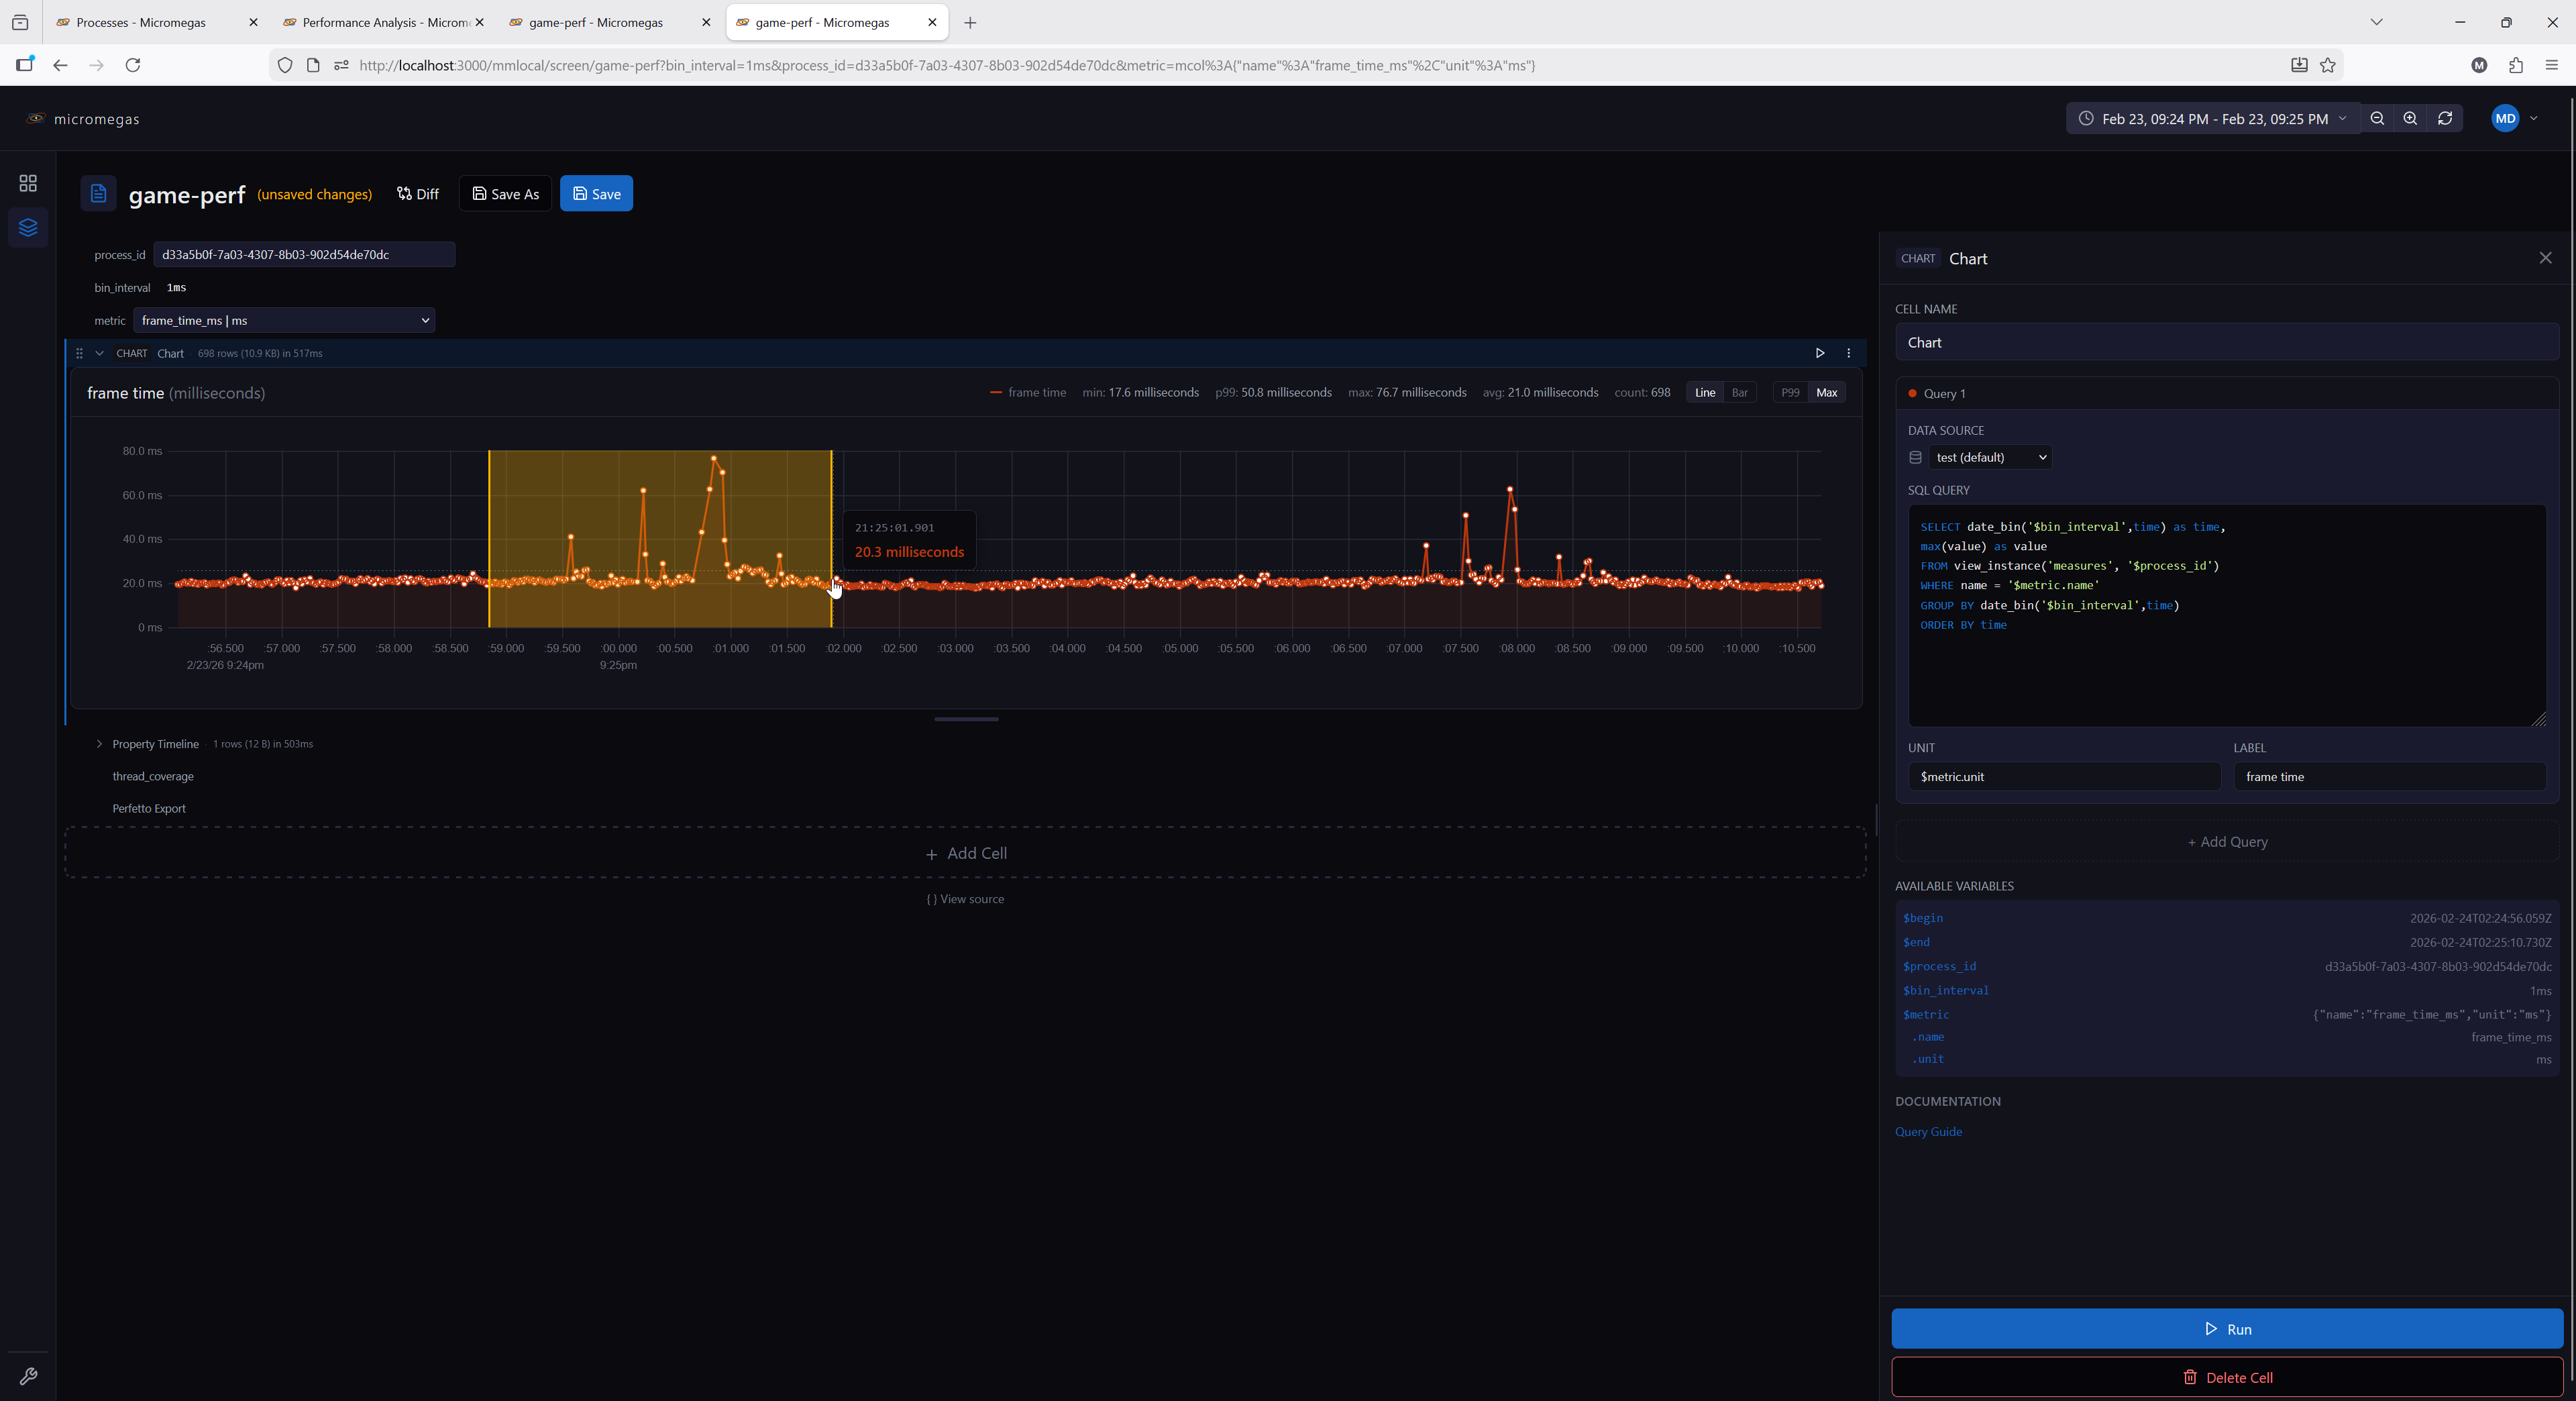
Multi-query time-series charts supporting line and bar chart types.
Configuration:
| Field | Type | Description |
|---|---|---|
queries |
array | One or more query definitions |
options.scale_mode |
'p99' | 'max' |
Y-axis scaling mode (default 'p99') |
options.chart_type |
'line' | 'bar' |
Chart type (default 'line') |
options.reference_lines |
array | Horizontal threshold lines drawn over the chart |
Query definition:
| Field | Type | Description |
|---|---|---|
sql |
string | SQL query returning X + Y columns (plus optional color) |
name |
string | Query name (used for WASM table registration) |
unit |
string | Y-axis unit label |
label |
string | Series label override |
color |
string | Series color #rrggbb (default: rotating palette) |
dataSource |
string | Per-query data source |
SQL columns:
| Column | Required | Description |
|---|---|---|
| X (1st non-color) | Yes | Timestamp, numeric, or string for categorical |
| Y (2nd non-color) | Yes | Numeric value |
color |
No | Per-row mark color — packed RGBA u32 (e.g. from rgba() or color_scale()), '#rrggbb'/'#rrggbbaa' string, or 4-byte binary |
The color column is identified by name (case-insensitive) and may appear in any position. When present, bars use per-row fill colors and lines use an interpolated gradient stroke. The query's color field above then acts as the legend token only — set it to a neutral color (e.g. gray) when the marks are SQL-colored.
Reference line fields:
| Field | Type | Description |
|---|---|---|
value |
number | string | Threshold value (or $macro) |
name |
string | Label prefix shown before the formatted value |
unit |
string | Unit of the value — selects the scale (default: primary series unit) |
color |
string | CSS color (default crimson #c62828) |
style |
'dashed' | 'solid' |
Line style (default 'dashed') |
Scale modes:
- p99 (default) — scales Y-axis to the 99th percentile, handling outliers gracefully
- max — scales Y-axis from 0 to the maximum value
Features:
- Multiple queries per chart, each with its own data source and unit
- User-chosen series color (editable color picker in the editor; default palette)
- SQL-driven per-row mark colors via
colorcolumn (rgba(),lerp_color(),color_scale()) - Horizontal reference lines at configurable thresholds
- Drag-to-zoom: drag horizontally on the chart to select a time range and zoom in
- Chart type and scale mode toggleable via controls
- Each query's results are registered in the WASM engine as
cellName.queryName— or justcellNameif the query has noname
Example — threshold-colored bars with a budget line:
SELECT
  time,
  frame_time_us AS value,
  CASE WHEN frame_time_us > $budget_us
    THEN rgba(0.8, 0.1, 0.1, 1.0)
    ELSE rgba(0.2, 0.7, 0.2, 1.0)
  END AS color
FROM frame_metrics
ORDER BY time
With options.reference_lines:
See color UDFs for rgba(), lerp_color(), and color_scale().
 Flame Graph
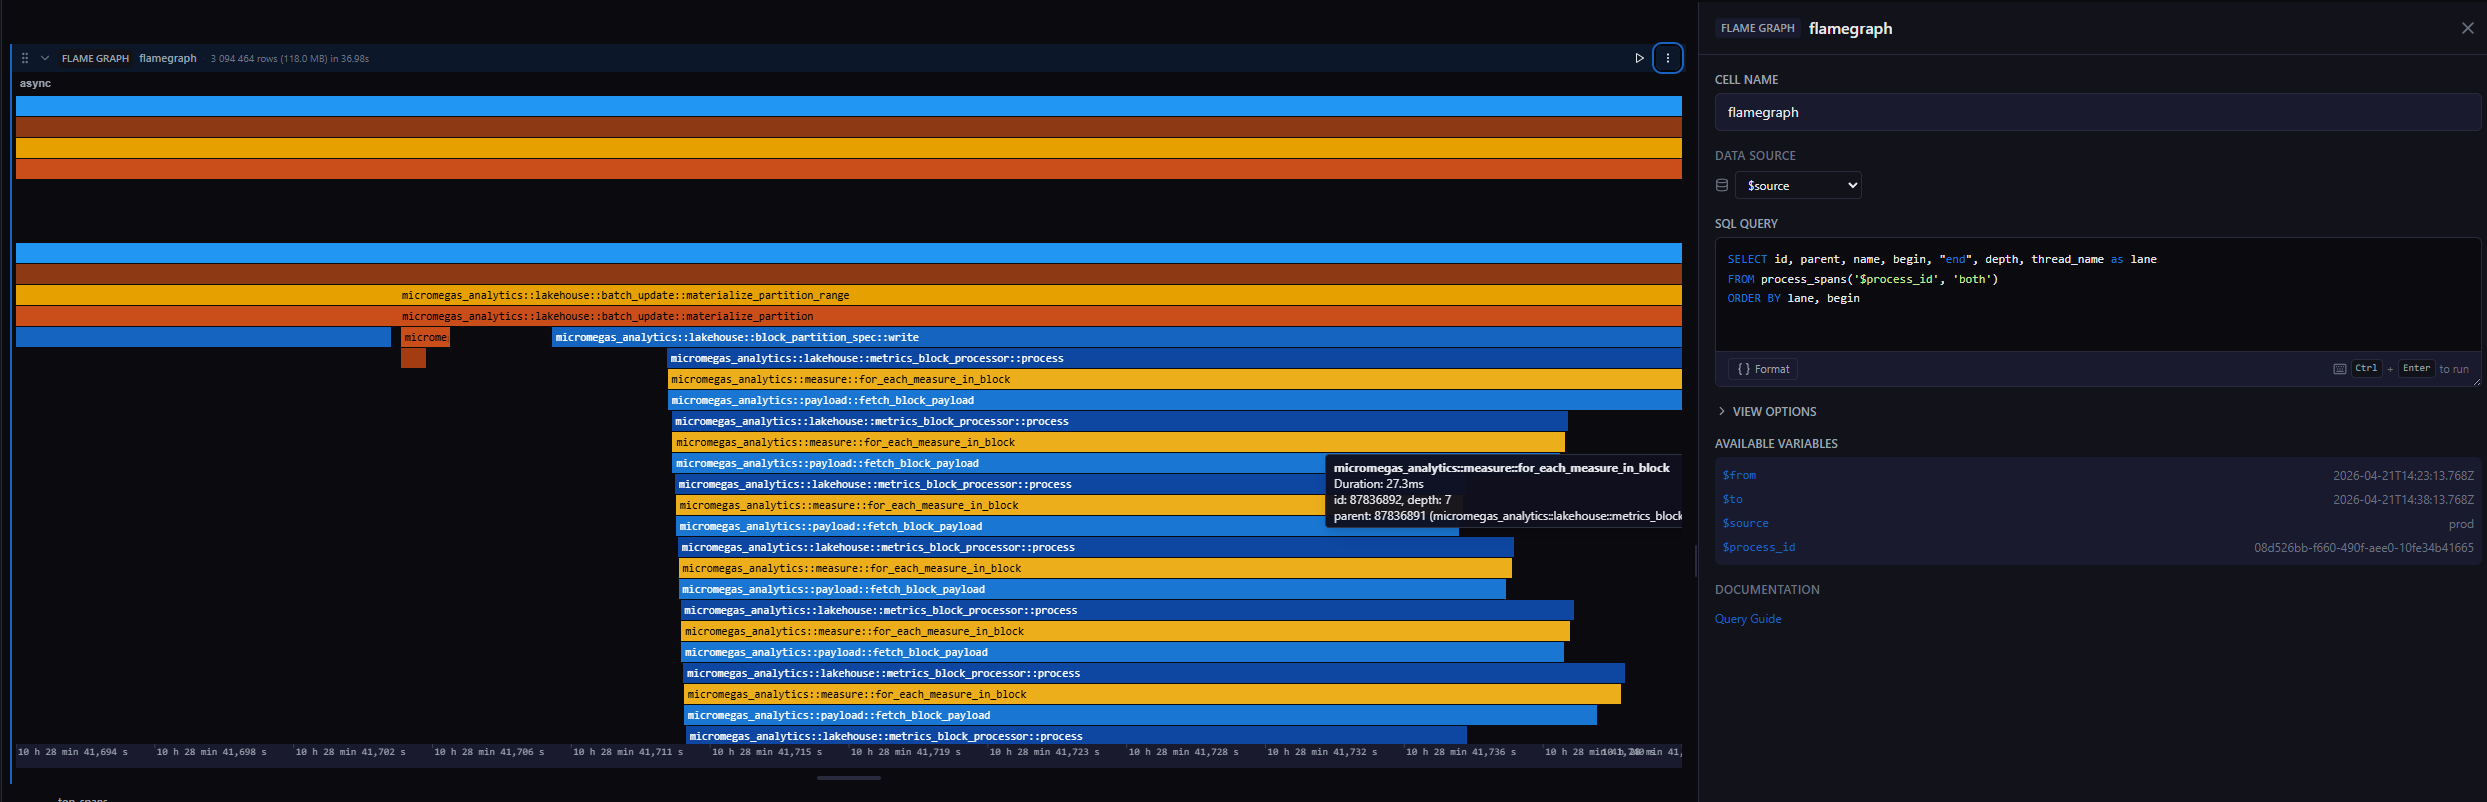
Interactive span visualization rendered with WebGL. Spans are grouped into lanes (one per thread or async scope) and stacked by call depth, with drag-to-zoom and WASD navigation.
Configuration:
| Field | Type | Description |
|---|---|---|
sql |
string | SQL query returning span data |
dataSource |
string | Data source override |
Options:
| Field | Type | Description |
|---|---|---|
initialFrom |
string | Initial zoomed-in start time (accepts $variable, relative like now-1h, or absolute) |
initialTo |
string | Initial zoomed-in end time |
initialFrom/initialTo only set the initial view window inside the flame graph (further zoom/pan is interactive) — they don't affect the query. To change what data the cell's SQL fetches, use the cell-level timeRange field instead (see Per-Cell Query Time Range).
Required columns:
| Column | Type | Description |
|---|---|---|
id |
bigint | Unique span identifier |
parent |
bigint | Parent span id (0 or null for roots) |
name |
string | Span name (used for label and color hash) |
begin |
timestamp | Span start time |
end |
timestamp | Span end time |
depth |
int | Call depth within the lane (UInt32 in process_spans) |
Optional columns:
| Column | Type | Description |
|---|---|---|
lane |
string | Lane name — one lane per distinct value (e.g., thread name, async). If omitted, all spans render in a single lane named default. The lane literally named async gets greedy-packed layout (see Features). |
Features:
- WebGL-rendered spans with Canvas2D label and time-axis overlay — handles millions of rows
- Color-coded by span name using a brand-derived rust/blue/gold palette
- Mouse wheel scrolls vertically across lanes (no zoom modifier — keeps the surrounding page reachable)
- Hover tooltip shows span name, duration, id, depth, and parent name (plus any of
target,filename,line,kind,bit_size, etc. when those columns are present in the result) - The lane literally named
asyncis laid out by greedy packing to avoid overlap; all other lanes use the rawdepthcolumn - Auto-detects the x-axis mode from the
begin/endcolumn types: timestamp columns drive time mode; numeric columns drive "bits" mode (used for memory snapshots). In bits mode,initialFrom/initialToare ignored. - Results registered in the local WASM query engine under the cell name for downstream queries
Interactions:
| Input | Action |
|---|---|
| Horizontal drag | Zoom into the dragged time range (local zoom) |
Alt + horizontal drag |
In time mode, broadcasts the dragged range to downstream cells via the cell's selection |
| Double-click | Reset zoom to the full data extent |
| Mouse wheel | Scroll vertically across lanes |
W / S |
Zoom in / out, anchored at the cursor |
A / D |
Pan left / right |
Keyboard input requires the flame graph to have keyboard focus (click it first).
Example SQL:
SELECT id, parent, name, begin, "end", depth, thread_name AS lane
FROM process_spans('$process_id', 'both')
ORDER BY lane, begin
The process_spans(process_id, types) table function returns thread spans, async spans, or 'both'.
 Horizontal Group (HG)
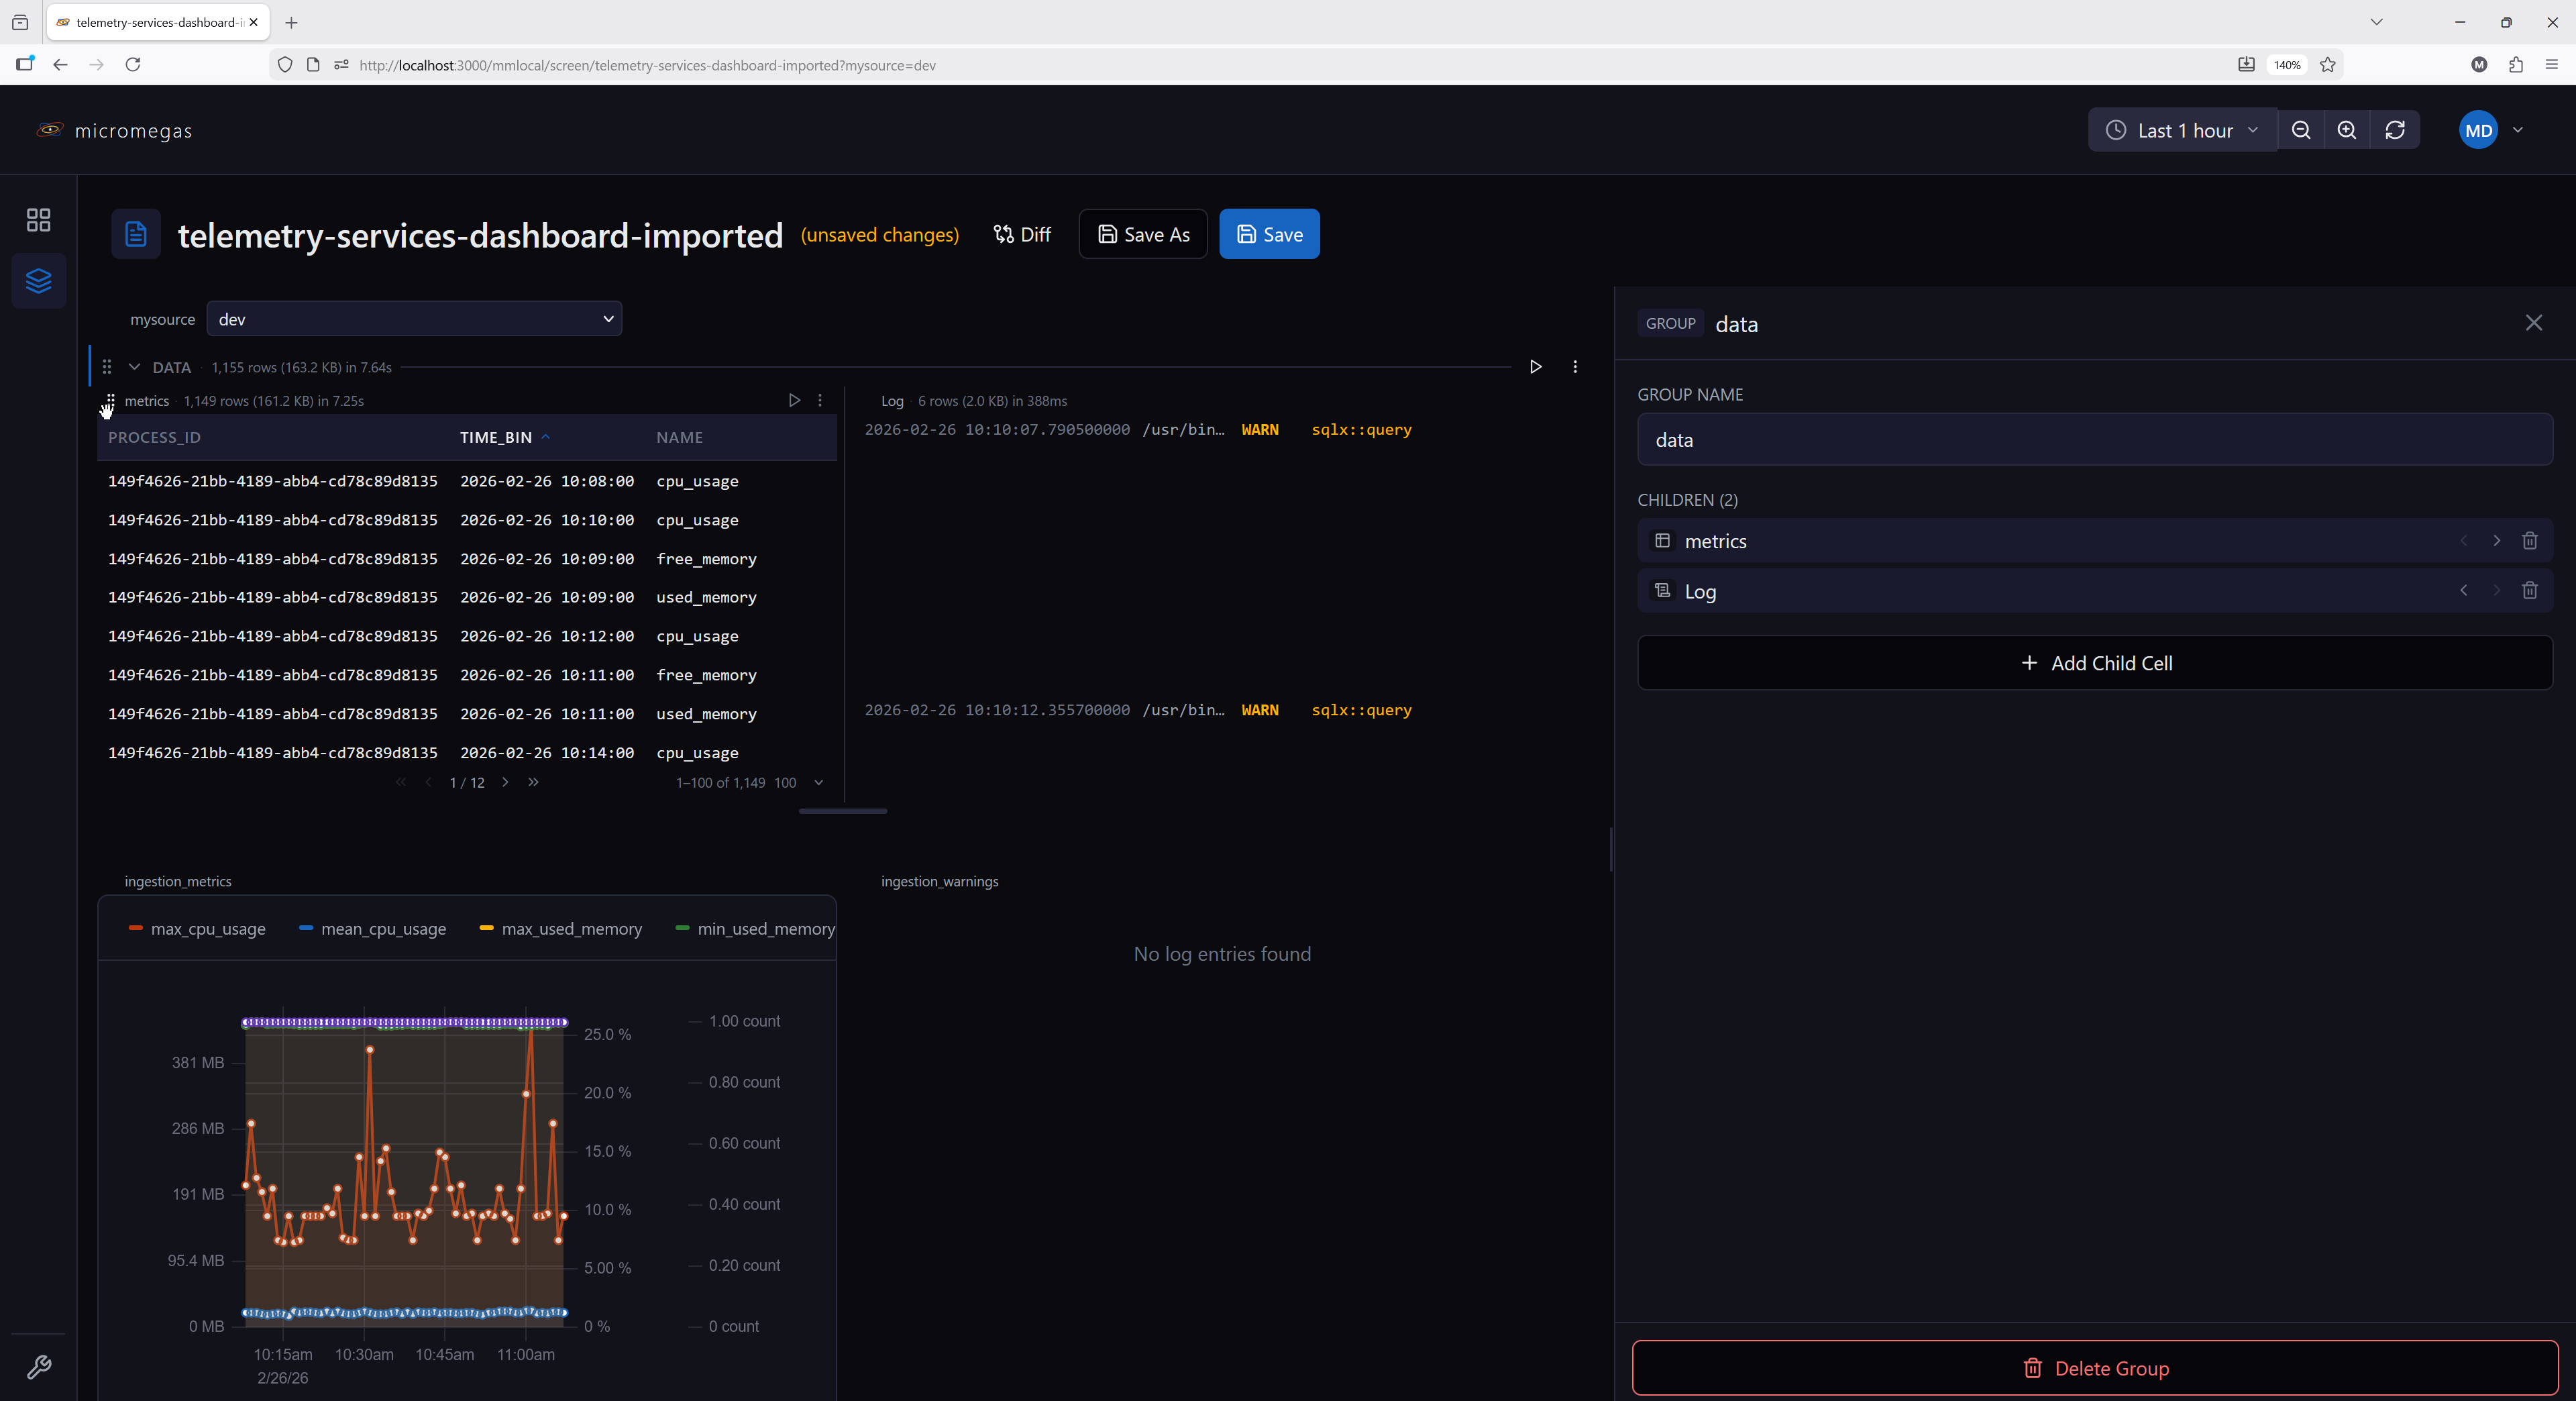
A container cell that arranges its children side by side in a horizontal layout.
Configuration:
| Field | Type | Description |
|---|---|---|
children |
array | Child cell configurations (any type except HG) |
Features:
- Children render side by side with equal width via flex layout
- Reorder via a drag handle (appears on hover over a child)
- Drag a child vertically more than ~30px outside the group bounds to extract it back to the main cell list
- Add new children via the group editor; remove a child via the "Remove from group" context-menu entry
- Each child has independent execution, state, and data source settings
- Aggregate stats (row count, byte size) displayed in the group header
Constraints:
- HG cells cannot be nested — no HG inside another HG
- During execution, children are flattened into the main sequence and execute left to right
- Variables defined in child cells are visible to cells below the group
Example use case:
Place two related charts side by side — one showing CPU usage and another showing memory usage — for a compact comparison view.
 Image
Screenshot carousel that queries the images view and steps through the resulting frames one at a time. Each row is one image — a timestamp, a name, a format, and the raw image bytes.
Configuration:
| Field | Type | Description |
|---|---|---|
sql |
string | SQL query returning image rows |
dataSource |
string | Data source override |
Required columns:
| Column | Type | Description |
|---|---|---|
time |
timestamp | Capture time, shown in the footer |
name |
string | Image label, shown in the footer |
format |
string | Image MIME type (e.g. image/png, image/jpeg) — used directly as the blob type |
data |
binary | Raw image bytes |
Features:
- Navigable carousel with first / previous / next / last controls and a position indicator
- Footer shows the current image's name, timestamp, and format
- The
formatvalue is used as the image MIME type; the browser decodes any format it natively supports (PNG, JPEG, GIF, WebP, etc.) - Decode failures (unsupported format, malformed
format, or corrupt data) surface a meaningful error in place of the image; null/emptyformatand nulldataare reported explicitly - Does not register results in the WASM engine (binary image data is not a queryable table)
Example SQL:
The images view is a per-process JIT materialized view populated by applications that emit image telemetry (e.g. screenshots via send_image).
 Log
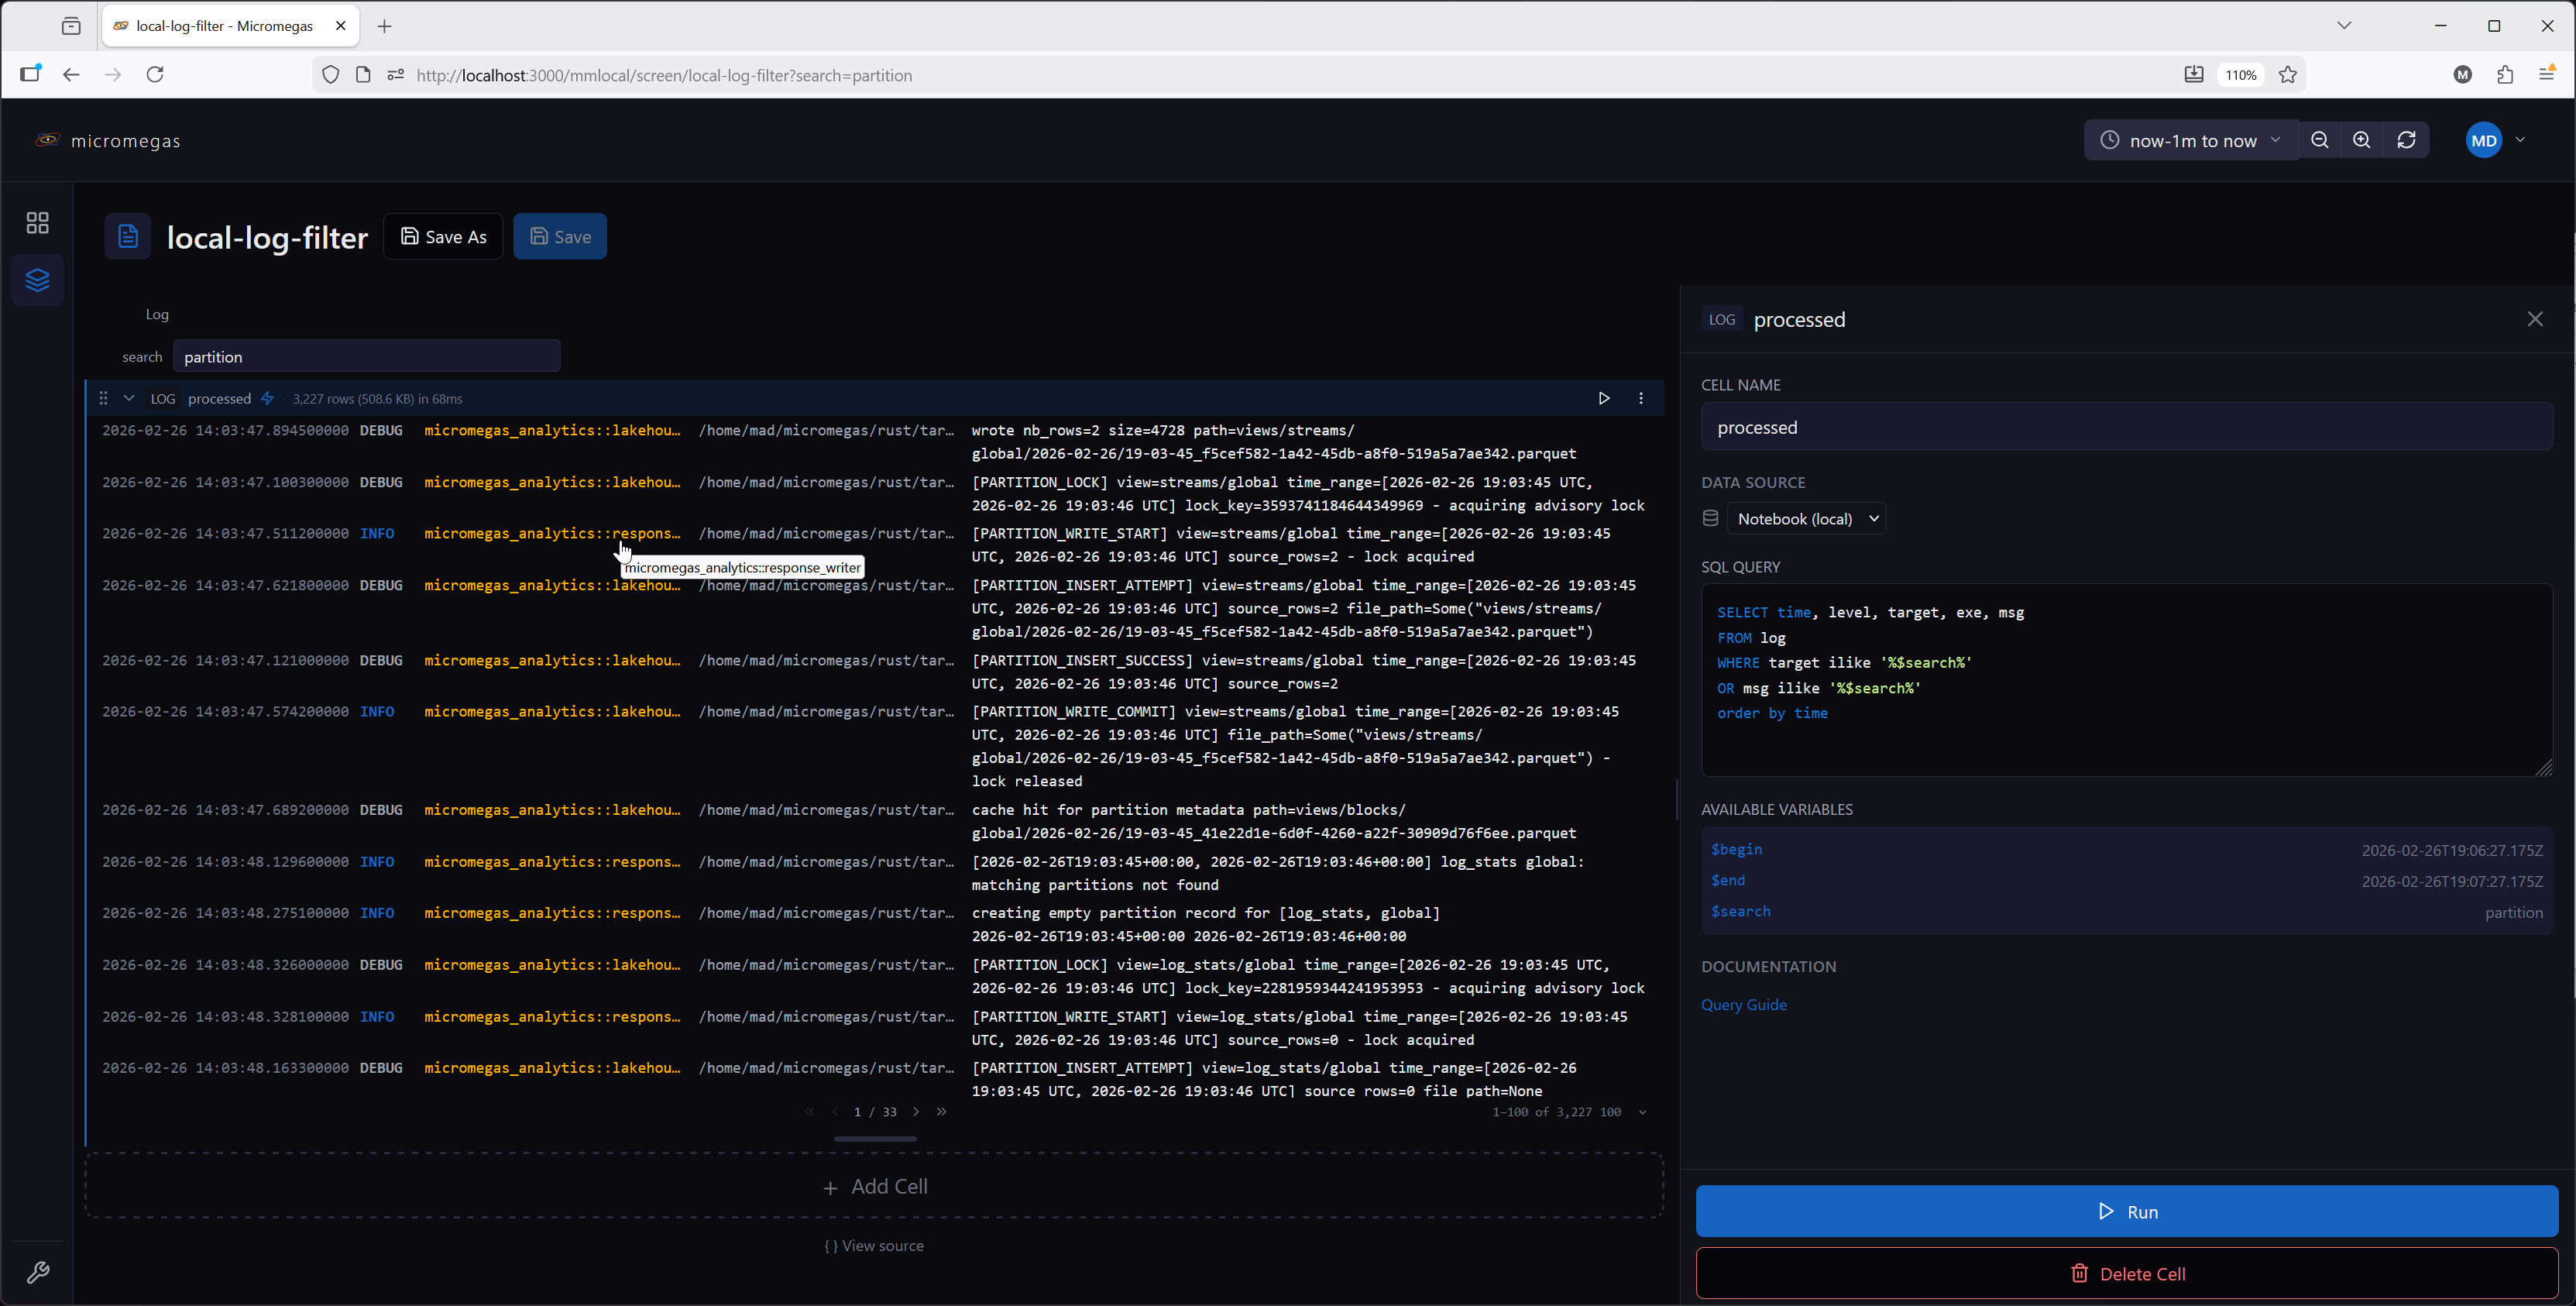
Log
SQL query results formatted as log entries with level-based coloring.
Configuration:
| Field | Type | Description |
|---|---|---|
sql |
string | SQL query returning log data |
dataSource |
string | Data source override |
Options:
| Field | Type | Description |
|---|---|---|
pageSize |
number | Entries per page (default: 100; selectable from 50 / 100 / 250 / 500 / 1000) |
Expected columns:
The renderer auto-classifies columns by name:
time— event timestamplevel— log level (FATAL,ERROR,WARN,INFO,DEBUG,TRACE)target— logger target/modulemsg— log message
Additional columns are sized to their content (up to the page width) — hover to see the full value in a tooltip. Columns are resizable by dragging the column header dividers. Each row has a one-click copy icon to copy the full row as JSON.
- Results registered in the local WASM query engine under the cell name for downstream queries
Level coloring:
| Level | Color |
|---|---|
| FATAL | Bright red |
| ERROR | Red |
| WARN | Yellow |
| INFO | Blue (link color) |
| DEBUG | Secondary text |
| TRACE | Muted |
Example SQL:
 Map
Map
3D map visualization that plots spatial events on a GLB model. Events are rendered as instanced sphere markers at their native (x, y, z) coordinates.
Configuration:
| Field | Type | Description |
|---|---|---|
sql |
string | SQL query returning spatial data |
dataSource |
string | Data source override |
Required columns:
| Column | Type | Description |
|---|---|---|
x |
number | X coordinate |
y |
number | Y coordinate |
z |
number | Z coordinate |
Any additional columns the query returns are addressable as $column in the detail template (see below).
Options:
| Field | Type | Default | Description |
|---|---|---|---|
mapUrl |
string | none | Bare GLB filename from the catalog (e.g. Arena_North.glb) — despite the name, not a URL; the renderer composes the blob URL at load time. |
shape |
'sphere' | 'box' |
'sphere' |
Marker primitive |
cameraKind |
'perspective' | 'orthographic' |
'perspective' |
Camera projection. Orthographic removes perspective foreshortening — better for flat heatmap-style data. Controls are identical in both modes. |
mapping |
object | per-shape defaults | Per-channel column-or-scalar bindings (see below) |
detailTemplate |
string | see below | Markdown template rendered in the event detail panel when a marker is clicked |
Channel mapping:
Marker appearance is driven by a mapping object whose channels depend on the selected shape:
| Channel | Shapes | Default scalar | Description |
|---|---|---|---|
x, y, z |
both | 'x', 'y', 'z' |
Position. Each entry is { column: name } to read per-row values, or { scalar: name } to remap to a differently-named column. Must resolve to numeric columns. |
size |
sphere | 10 |
Uniform radius. |
scaleX, scaleY, scaleZ |
box | 100 each |
Per-axis extents. |
color |
both | 0xbf360cff (Rust orange) |
Marker color. Scalar is an RGBA u32 (also accepts #rrggbb / #rrggbbaa strings in the editor). Column bindings accept three column kinds — see below. |
Each non-position channel is { scalar: value } (applies to every row) or { column: name } (reads from that column). String scalars may contain notebook macros ($mySize, $cell.selected.radius) — they are re-resolved at render time, so editor scrubbing stays cheap without rebuilding the per-instance buffers.
Color column encodings:
When color is column-bound, the renderer accepts three column types. UInt32 is the idiomatic form — the built-in color UDFs all return UInt32 in 0xRRGGBBAA byte order:
| UDF | Signature | Description |
|---|---|---|
rgba(r, g, b, a) |
(f64, f64, f64, f64) → UInt32 |
Pack four [0.0, 1.0] channels (out-of-range values clamp at the byte boundary). |
lerp_color(c1, c2, t) |
(UInt32, UInt32, f64) → UInt32 |
Linear interpolation between two packed colors in straight-alpha sRGB. |
color_scale(name, t, alpha) |
(string, f64, f64) → UInt32 |
Perceptually-uniform colormap sample ('viridis', 'magma', etc). |
The full set of accepted column types:
| Column type | Encoding |
|---|---|
| UInt32 (or any integer) | Packed RGBA in 0xRRGGBBAA order — the form emitted by rgba(), lerp_color(), and color_scale(). |
| String | Hex literal — '#rrggbb' (alpha = 0xff) or '#rrggbbaa'. |
| Binary (4 bytes) | R, G, B, A byte order — DataFusion produces this for raw 0xrrggbbaa hex literals in SQL. |
Non-finite numeric values (NaN, null) in any column-bound numeric channel fail the build with a row-level error — filter them in SQL.
Detail template:
When a marker is selected, the cell renders a Markdown template with macro
substitution. The same template is also shown as a transient tooltip that
follows the cursor while you hover a marker (clicking still opens the docked
panel). The hover tooltip is on by default; uncheck Show as a tooltip when
hovering a marker to disable it, and leaving the template empty disables it
too. The selected row's columns are exposed as $column, and the standard
notebook macros work too:
$column— column from the selected row (wins name collisions against variables)$from,$to— current time range$variable,$variable.column— notebook variables and their columns$cell[N].column,$cell.selected.column— cross-cell references
Each $column carries its Arrow type, so timestamp columns render as RFC3339
and numeric columns can be wrapped with format_value for adaptive units —
e.g. format_value($bytes_sent, 'bytes') renders 3.4 GB. The raw,
full-precision value reaches format_value (no intermediate stringification),
matching the table cell's override-template capability.
The default template is:
Authors extend it to surface query-specific columns. For example, to link to
the process page using a process_id column:
Internal links (starting with /) route through the app's base-path-aware
router; external links open in a new tab. Raw HTML in the template is
rendered as text (not parsed), matching the Markdown cell's behavior.
Coordinate frame:
Events are placed at their raw x, y, z values without any runtime transform. The renderer assumes Z-up; handedness and units must match between the GLB and the event data (no specific units are required). See Admin → Maps for the full GLB authoring contract and catalog configuration.
Features:
- Instanced rendering — handles hundreds of thousands of markers efficiently
- Interactive markers — click to select, hover to highlight and preview the detail template as a cursor tooltip
- Event detail panel rendered from a Markdown template with macro substitution
- Results registered in the local WASM query engine under the cell name for downstream queries
Camera controls:
The same controls apply in both perspective and orthographic camera modes.
| Input | Action |
|---|---|
| Left-drag | Pan (top-down XY translation) |
| Right-drag | Orbit around the look-at point. Pitch is clamped to keep the camera above the horizon. |
| Ctrl/Cmd + wheel | Zoom, anchored to the point under the cursor. Plain wheel scrolls the surrounding page. |
W / S |
Pan along the camera-up vector (camera-relative — tilting the view changes the world direction) |
A / D |
Strafe along the camera-right vector |
Q / E |
Move along the camera-forward vector (perspective); zoom in / out (orthographic) |
Z |
Reset view to the initial framing |
Keyboard controls (WASD/QE/Z) require the pointer to be over the map — keeps multiple Map cells on the same page from moving together and ignores keystrokes typed into form inputs.
Example SQL (spatial events from a JSONB-encoded payload):
SELECT
  time,
  process_id,
  jsonb_as_f64(jsonb_path_query_first(msg_jsonb, '$.position[0]')) as x,
  jsonb_as_f64(jsonb_path_query_first(msg_jsonb, '$.position[1]')) as y,
  jsonb_as_f64(jsonb_path_query_first(msg_jsonb, '$.position[2]')) as z,
  jsonb_as_string(jsonb_path_query_first(msg_jsonb, '$.actor_id')) as actor_id,
  jsonb_as_string(jsonb_path_query_first(msg_jsonb, '$.event_type')) as event_type
FROM events
WHERE name = 'spatial_event'
LIMIT 10000
 Markdown
Static text and documentation using GitHub Flavored Markdown.
Configuration:
| Field | Type | Description |
|---|---|---|
content |
string | Markdown text to render |
Features:
- Full GitHub Flavored Markdown: headings, tables, lists, code blocks, strikethrough
- Supports variable substitution:
$variable,$variable.column,$from,$to - Validates macro references during editing — warns about undefined variables
- Does not execute queries or block downstream cells
- Rendered output appears only after the cell's turn in sequential execution — the body stays blank until upstream variables and cell results are resolved, so macros never display stale or broken values on first paint
Example content:
 Perfetto Export
Exports trace data to Perfetto UI for visualization, or downloads it as a file.
Configuration:
| Field | Type | Description |
|---|---|---|
processIdVar |
string | Variable name containing the process ID (default: $process_id) |
spanType |
'thread' | 'async' | 'both' |
Which span types to include (default: both) |
dataSource |
string | Data source override |
Features:
- Split button: Open in Perfetto (primary) or Download (secondary)
- Download saves a Perfetto protobuf trace as
trace-{processId}.pb - Shows a warning if the referenced variable is empty or undefined
- Caches the generated trace buffer — cleared when process ID, span type, time range, or data source changes
- Progress indicator during trace generation (shows running MB received as chunks stream in)
- No automatic execution — triggered by user button click
 Property Timeline
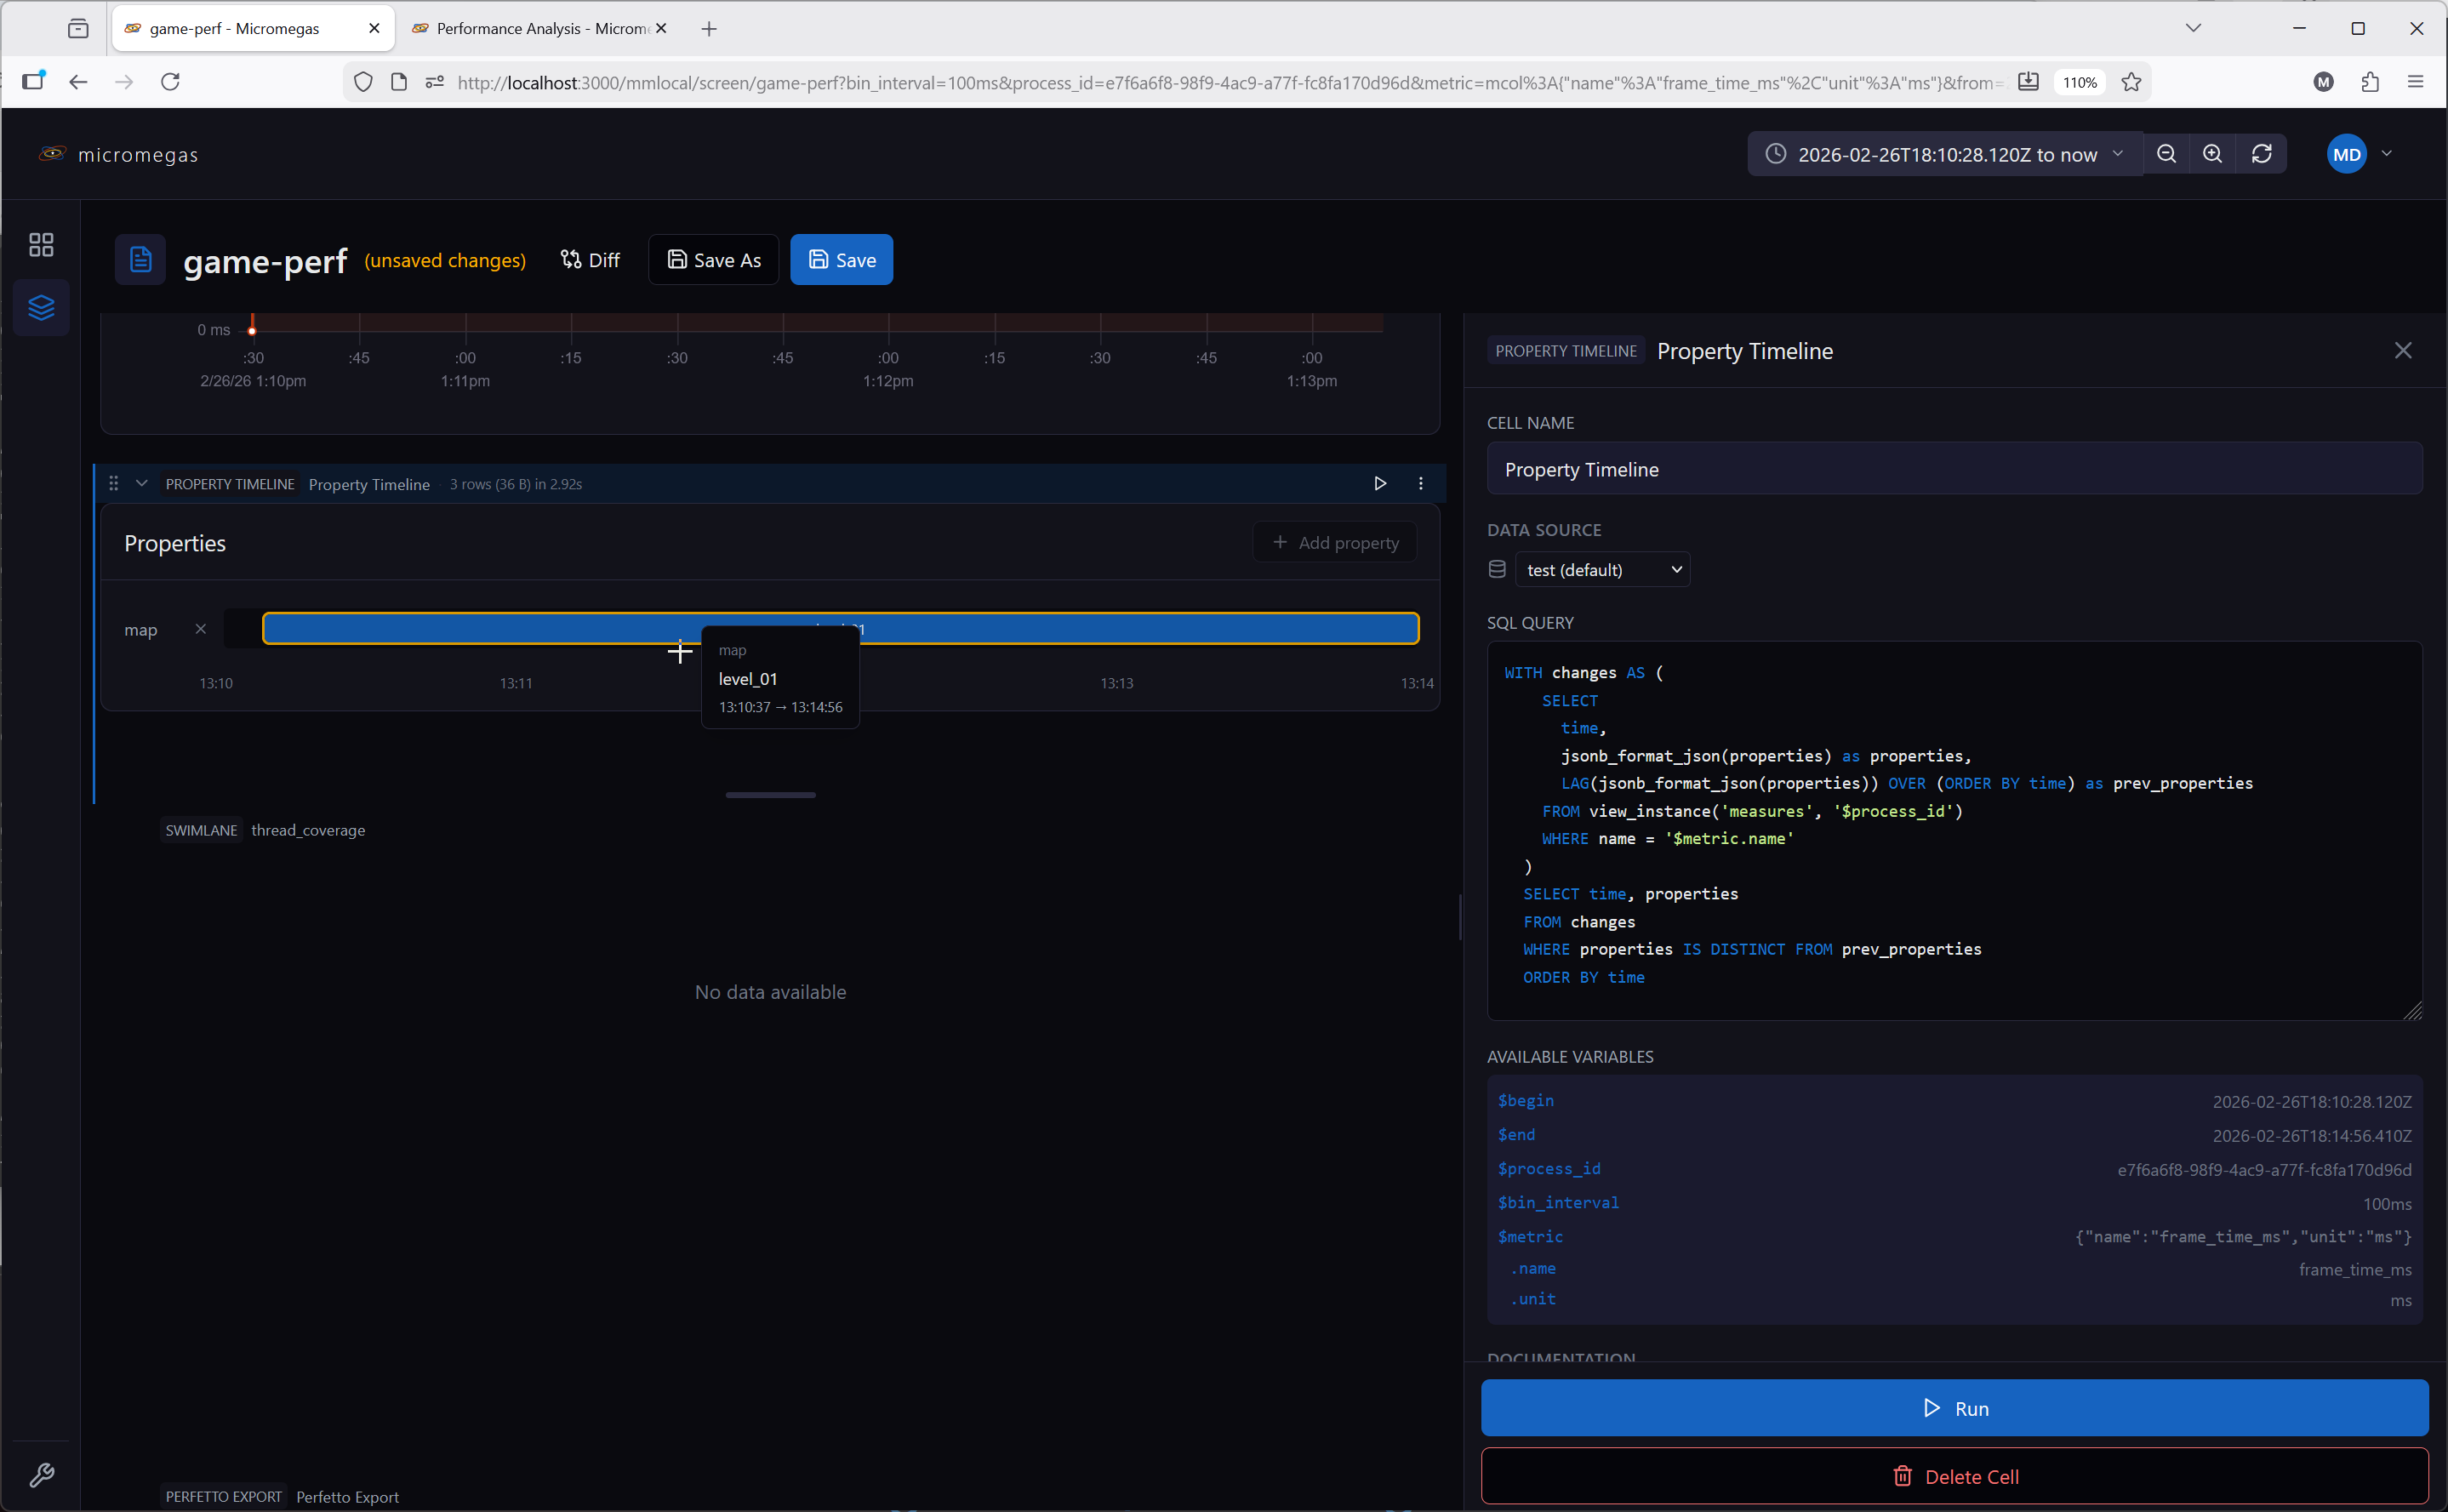
Visualizes how JSON properties change over time as horizontal timeline segments.
Configuration:
| Field | Type | Description |
|---|---|---|
sql |
string | SQL query returning time and properties (JSON) columns |
dataSource |
string | Data source override |
Options:
| Field | Type | Description |
|---|---|---|
selectedKeys |
string[] | Property keys to display as timeline tracks |
Features:
- Parses JSON properties from each row and detects value changes
- Each selected property key displays as a horizontal timeline track
- Interactive key selection — add or remove property keys from the display
- Time range zoom via drag selection
- Fills time gaps with "no value" state
- Results registered in the local WASM query engine under the cell name for downstream queries
Expected columns:
time— timestampproperties— JSON object string (e.g.,{"cpu": 45, "state": "running"})
 Reference Table
Embeds inline CSV data that is registered as a queryable table in the local WASM query engine. Downstream cells can query it by the cell's name.
Configuration:
| Field | Type | Description |
|---|---|---|
csv |
string | CSV data with headers in the first row |
Options:
The editor only exposes the CSV body. The renderer honors sortColumn, sortDirection, pageSize, and hiddenColumns in the raw config if present, but there is no UI to set them.
Features:
- CSV parsed with d3-dsv (RFC 4180 quoting/escaping)
- Type inference is per-column: a column becomes
Float64if every non-empty cell parses as a finite number; otherwiseUtf8(string). Empty cells becomeNaN(numeric) or''(string) - Empty or header-only input is rejected with an error
- Registered in the WASM engine under the cell name — queryable by downstream cells
- Displays as a sortable, paginated table (same UI as the Table cell). Row selection is not supported.
- Useful for lookup tables, configuration data, or reference values
Example:
A cell named thresholds with this CSV:
Can be queried by a downstream table cell:
SELECT m.name, m.value, t.warn_threshold, t.error_threshold
FROM raw_metrics m
JOIN thresholds t ON m.name = t.metric
WHERE m.value > t.warn_threshold
 Swimlane
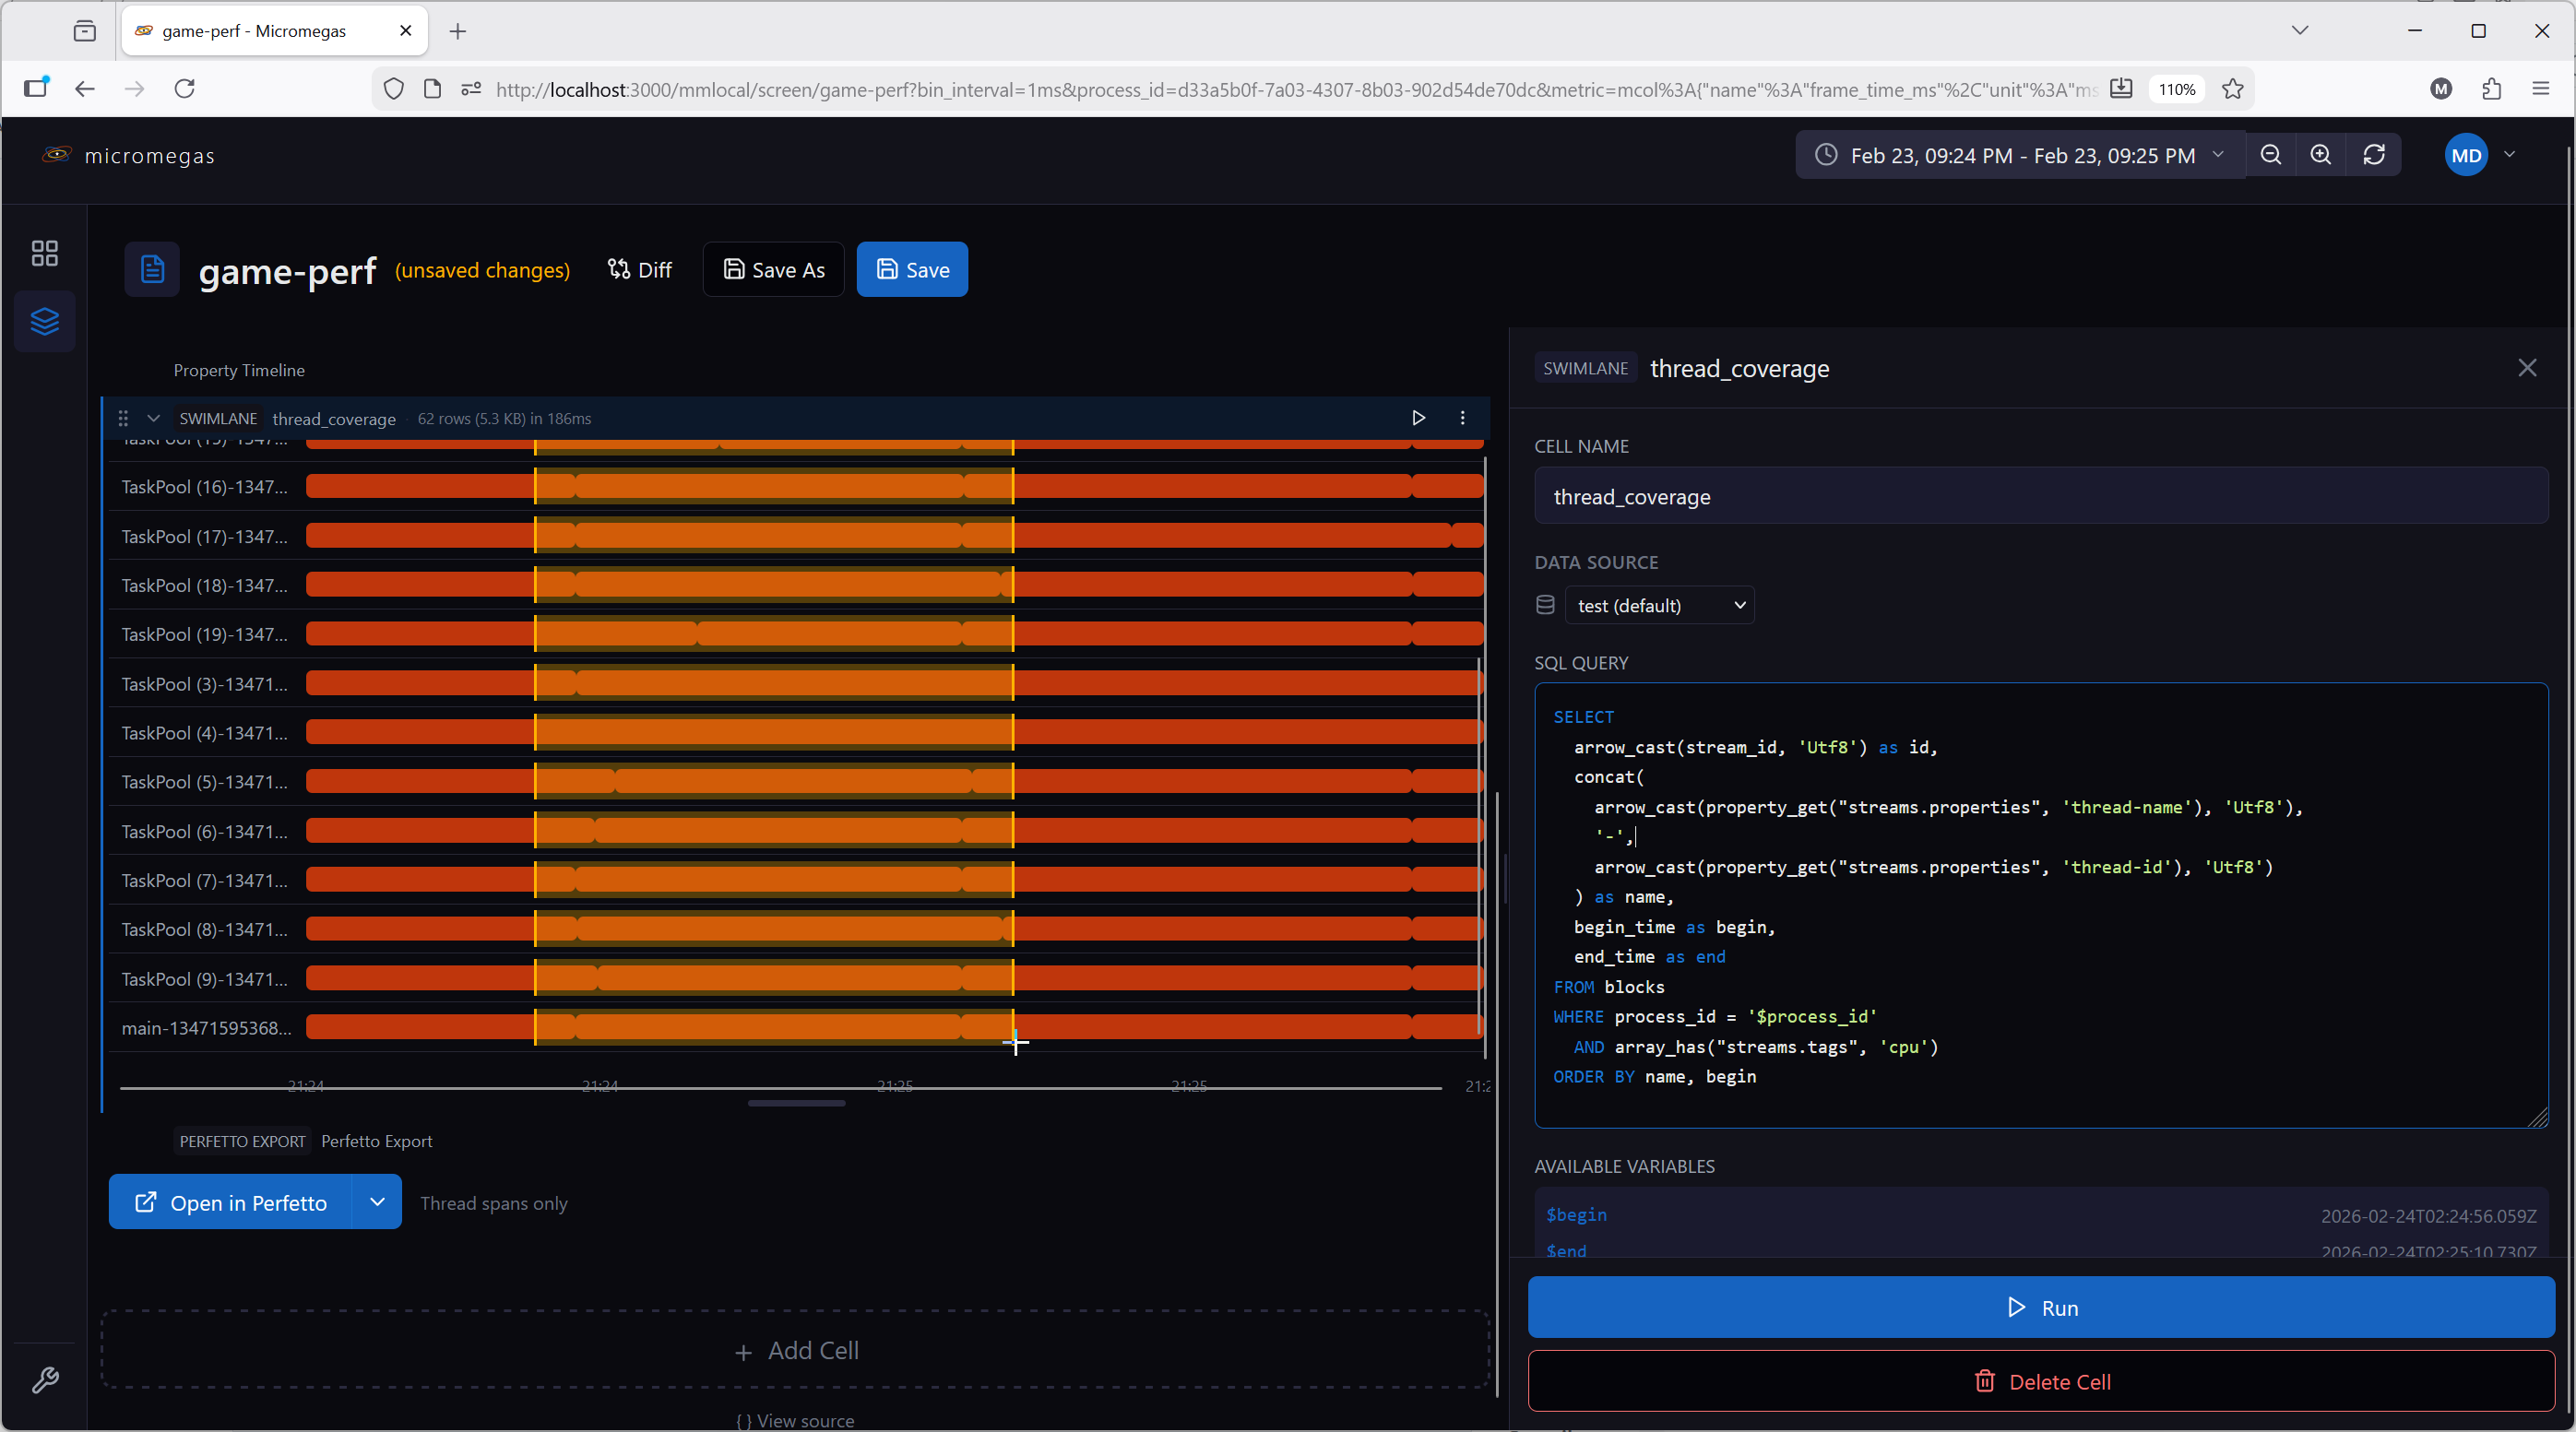
Horizontal lane visualization for thread or async activity over time. Each lane shows one or more time segments as horizontal bars.
Configuration:
| Field | Type | Description |
|---|---|---|
sql |
string | SQL query returning lane data |
dataSource |
string | Data source override |
Required columns:
| Column | Type | Description |
|---|---|---|
id |
string | Unique lane identifier |
name |
string | Lane display name |
begin |
timestamp | Segment start time |
end |
timestamp | Segment end time |
Optional columns:
| Column | Type | Description |
|---|---|---|
label |
string | Text displayed inside each segment bar; shown in a tooltip on hover alongside the lane name and time range |
color |
integer / string / binary | Per-segment bar color — packed RGBA u32 (e.g. from rgba() or color_scale()), '#rrggbb'/'#rrggbbaa' string, or 4-byte binary |
Multiple rows with the same id create multiple segments in one lane. Lanes are ordered by first occurrence in the query results.
Features:
- Fixed label column on the left with lane names
- Horizontal time bars in the center
- Horizontal drag selects a time range; broadcasts the selection to downstream cells (
$cellname.selected.begin,$cellname.selected.end) - Time axis with formatted tick marks
- Results registered in the local WASM query engine under the cell name for downstream queries
Example SQL:
SELECT
  arrow_cast(stream_id, 'Utf8') as id,
  concat(
    arrow_cast(property_get("streams.properties", 'thread-name'), 'Utf8'),
    '-',
    arrow_cast(property_get("streams.properties", 'thread-id'), 'Utf8')
  ) as name,
  begin_time as begin,
  end_time as end
FROM blocks
WHERE process_id = '$process_id'
  AND array_has("streams.tags", 'cpu')
ORDER BY name, begin
 Table
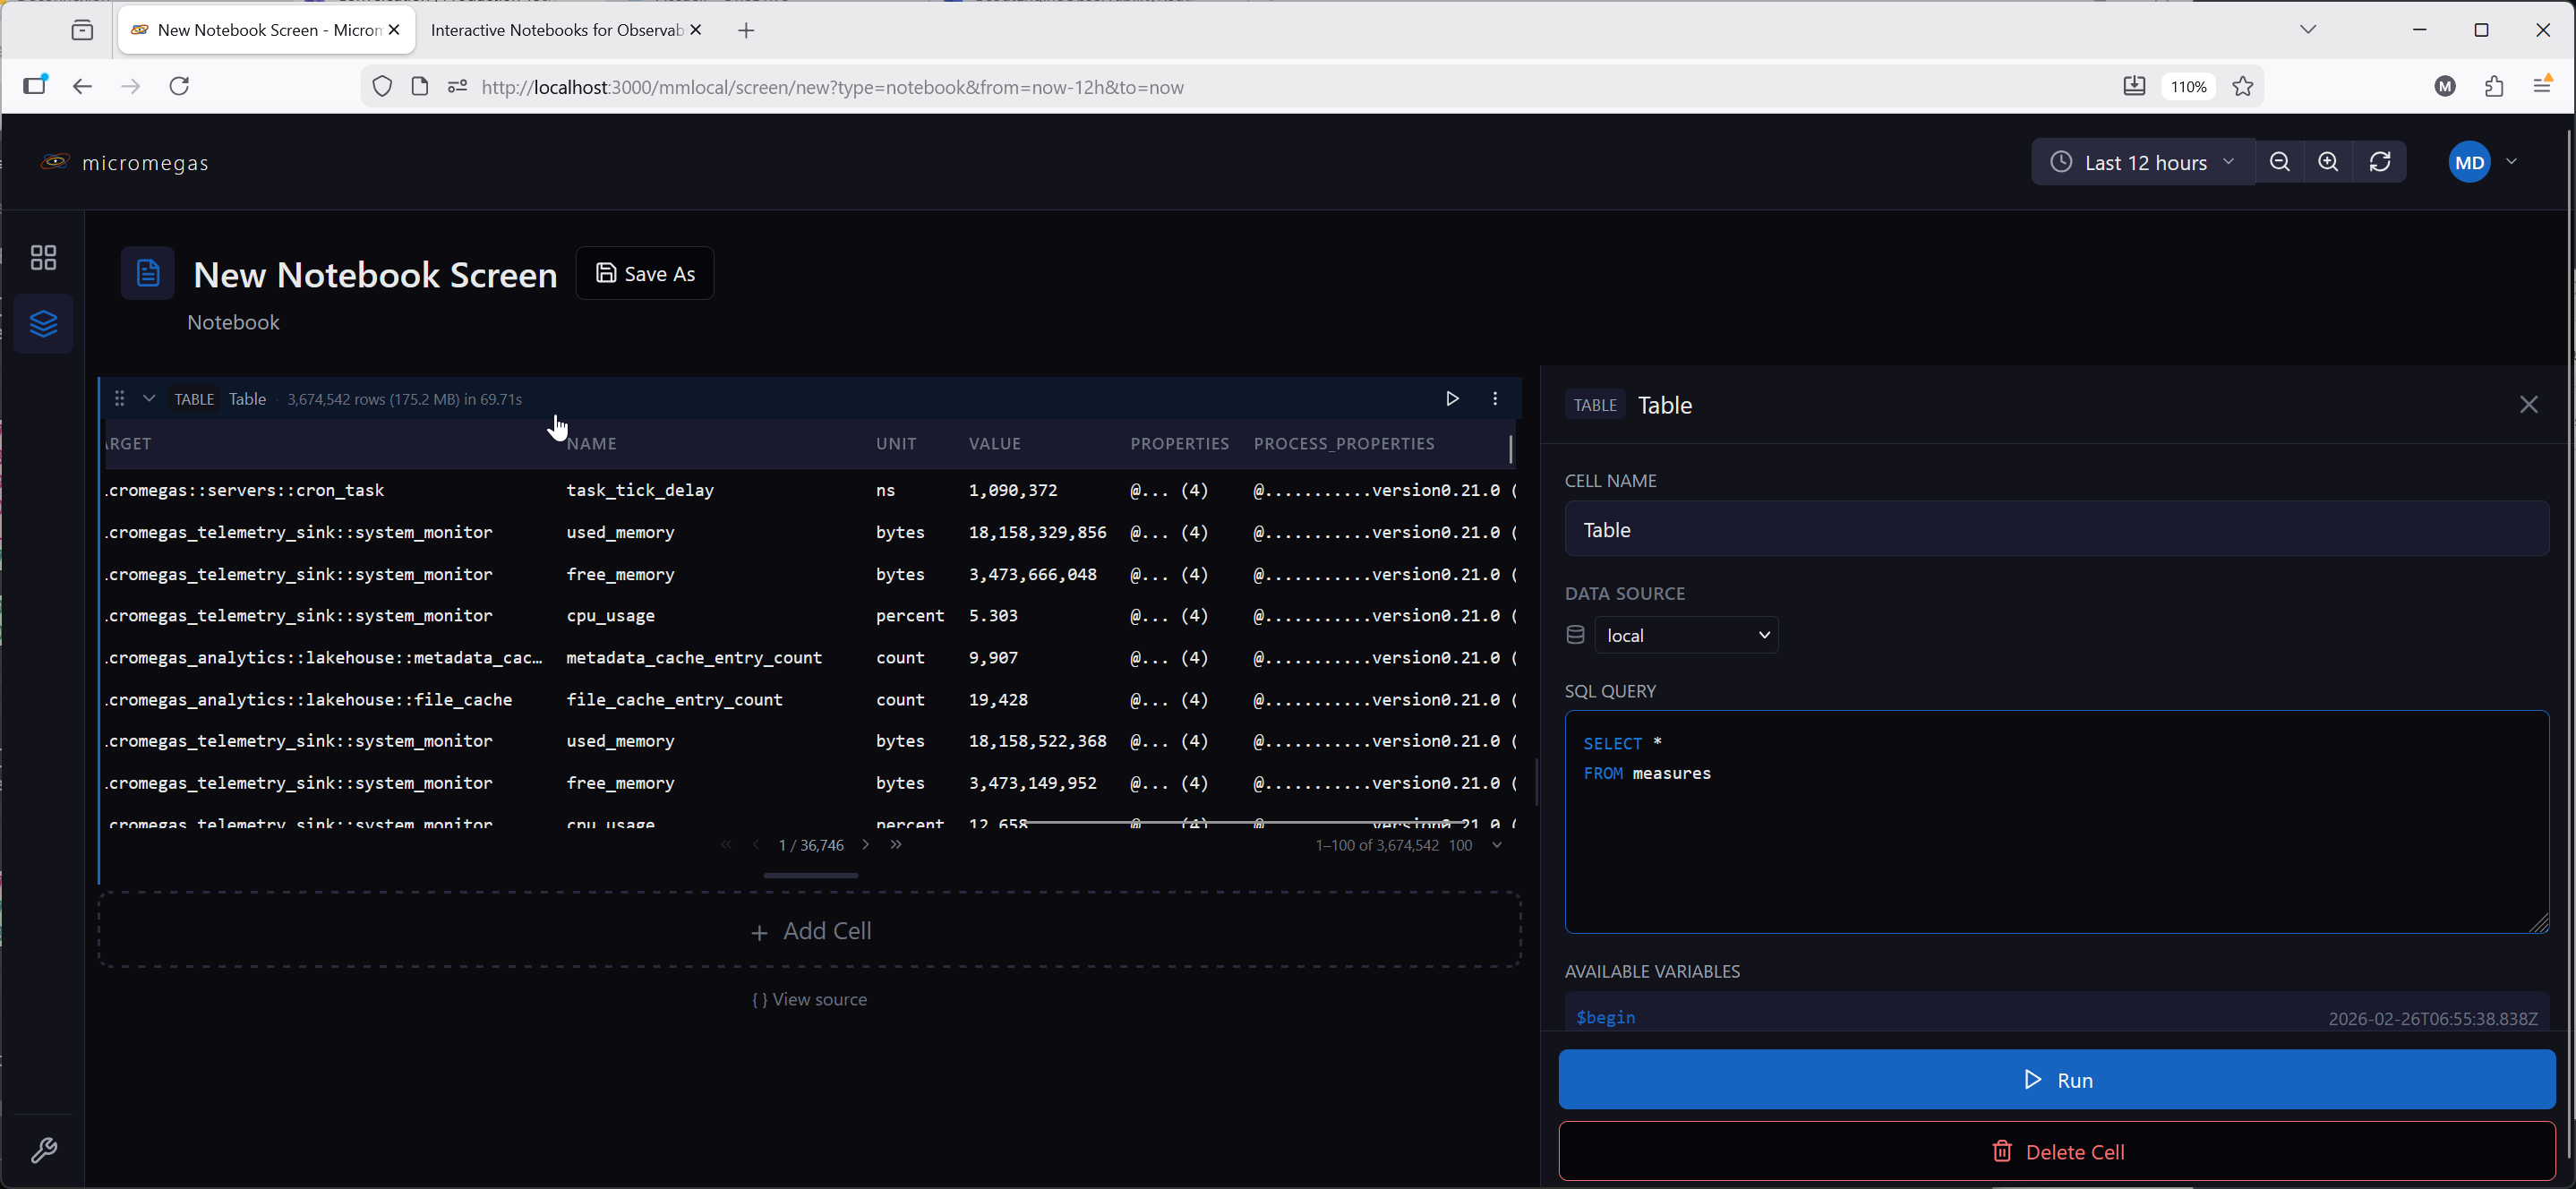
SQL query results displayed in a sortable, paginated table.
Configuration:
| Field | Type | Description |
|---|---|---|
sql |
string | SQL query with macro substitution |
dataSource |
string | Data source override |
Options:
| Field | Type | Description |
|---|---|---|
sortColumn |
string | Currently sorted column |
sortDirection |
'asc' | 'desc' |
Sort direction |
pageSize |
number | Rows per page (default: 100; selectable from 50 / 100 / 250 / 500 / 1000) |
hiddenColumns |
string[] | Columns to hide |
overrides |
array | Column format overrides — each entry { column, format } |
selectionMode |
'none' | 'single' |
Whether clicking a row publishes a selection to downstream cells (default 'none') |
Features:
- Sticky header with click-to-sort columns
- Column hiding via context menu, with a restoration bar to unhide
- Client-side pagination with configurable page size
- Sort column available as
$order_bymacro in SQL for server-side sorting - Column format overrides with markdown and row macros (
$row.columnName) - With
selectionMode: 'single', the selected row is exposed to downstream cells as$cellname.selected.column - Results registered in the local WASM query engine under the cell name for downstream queries
Column format overrides:
Override how a column renders by providing a markdown format string with row macros:
This renders the exe column as a link to the process page.
Example SQL:
 Transposed Table
SQL results with rows and columns swapped. The original column names become the first column, and each result row becomes a subsequent column. Useful for displaying metadata or key-value properties.
Configuration:
Same as Table — sql, dataSource. The transposed view has no pagination (all rows scroll inside the cell).
Options:
| Field | Type | Description |
|---|---|---|
hiddenRows |
string[] | Hidden row names (original column names) |
overrides |
array | Row rendering overrides — each entry { column, format }, where column is the original column name (now a row label) |
Features:
- Row hiding via right-click context menu, with a restoration bar to unhide
- Row format overrides with markdown and row macros (same syntax as table column overrides)
- Results registered in the local WASM query engine under the cell name for downstream queries
Example:
A query returning process_id, exe, username, computer for a single row displays as:
| Field | Value |
|---|---|
| process_id | abc-123 |
| exe | my-service |
| username | admin |
| computer | prod-01 |
 Variable
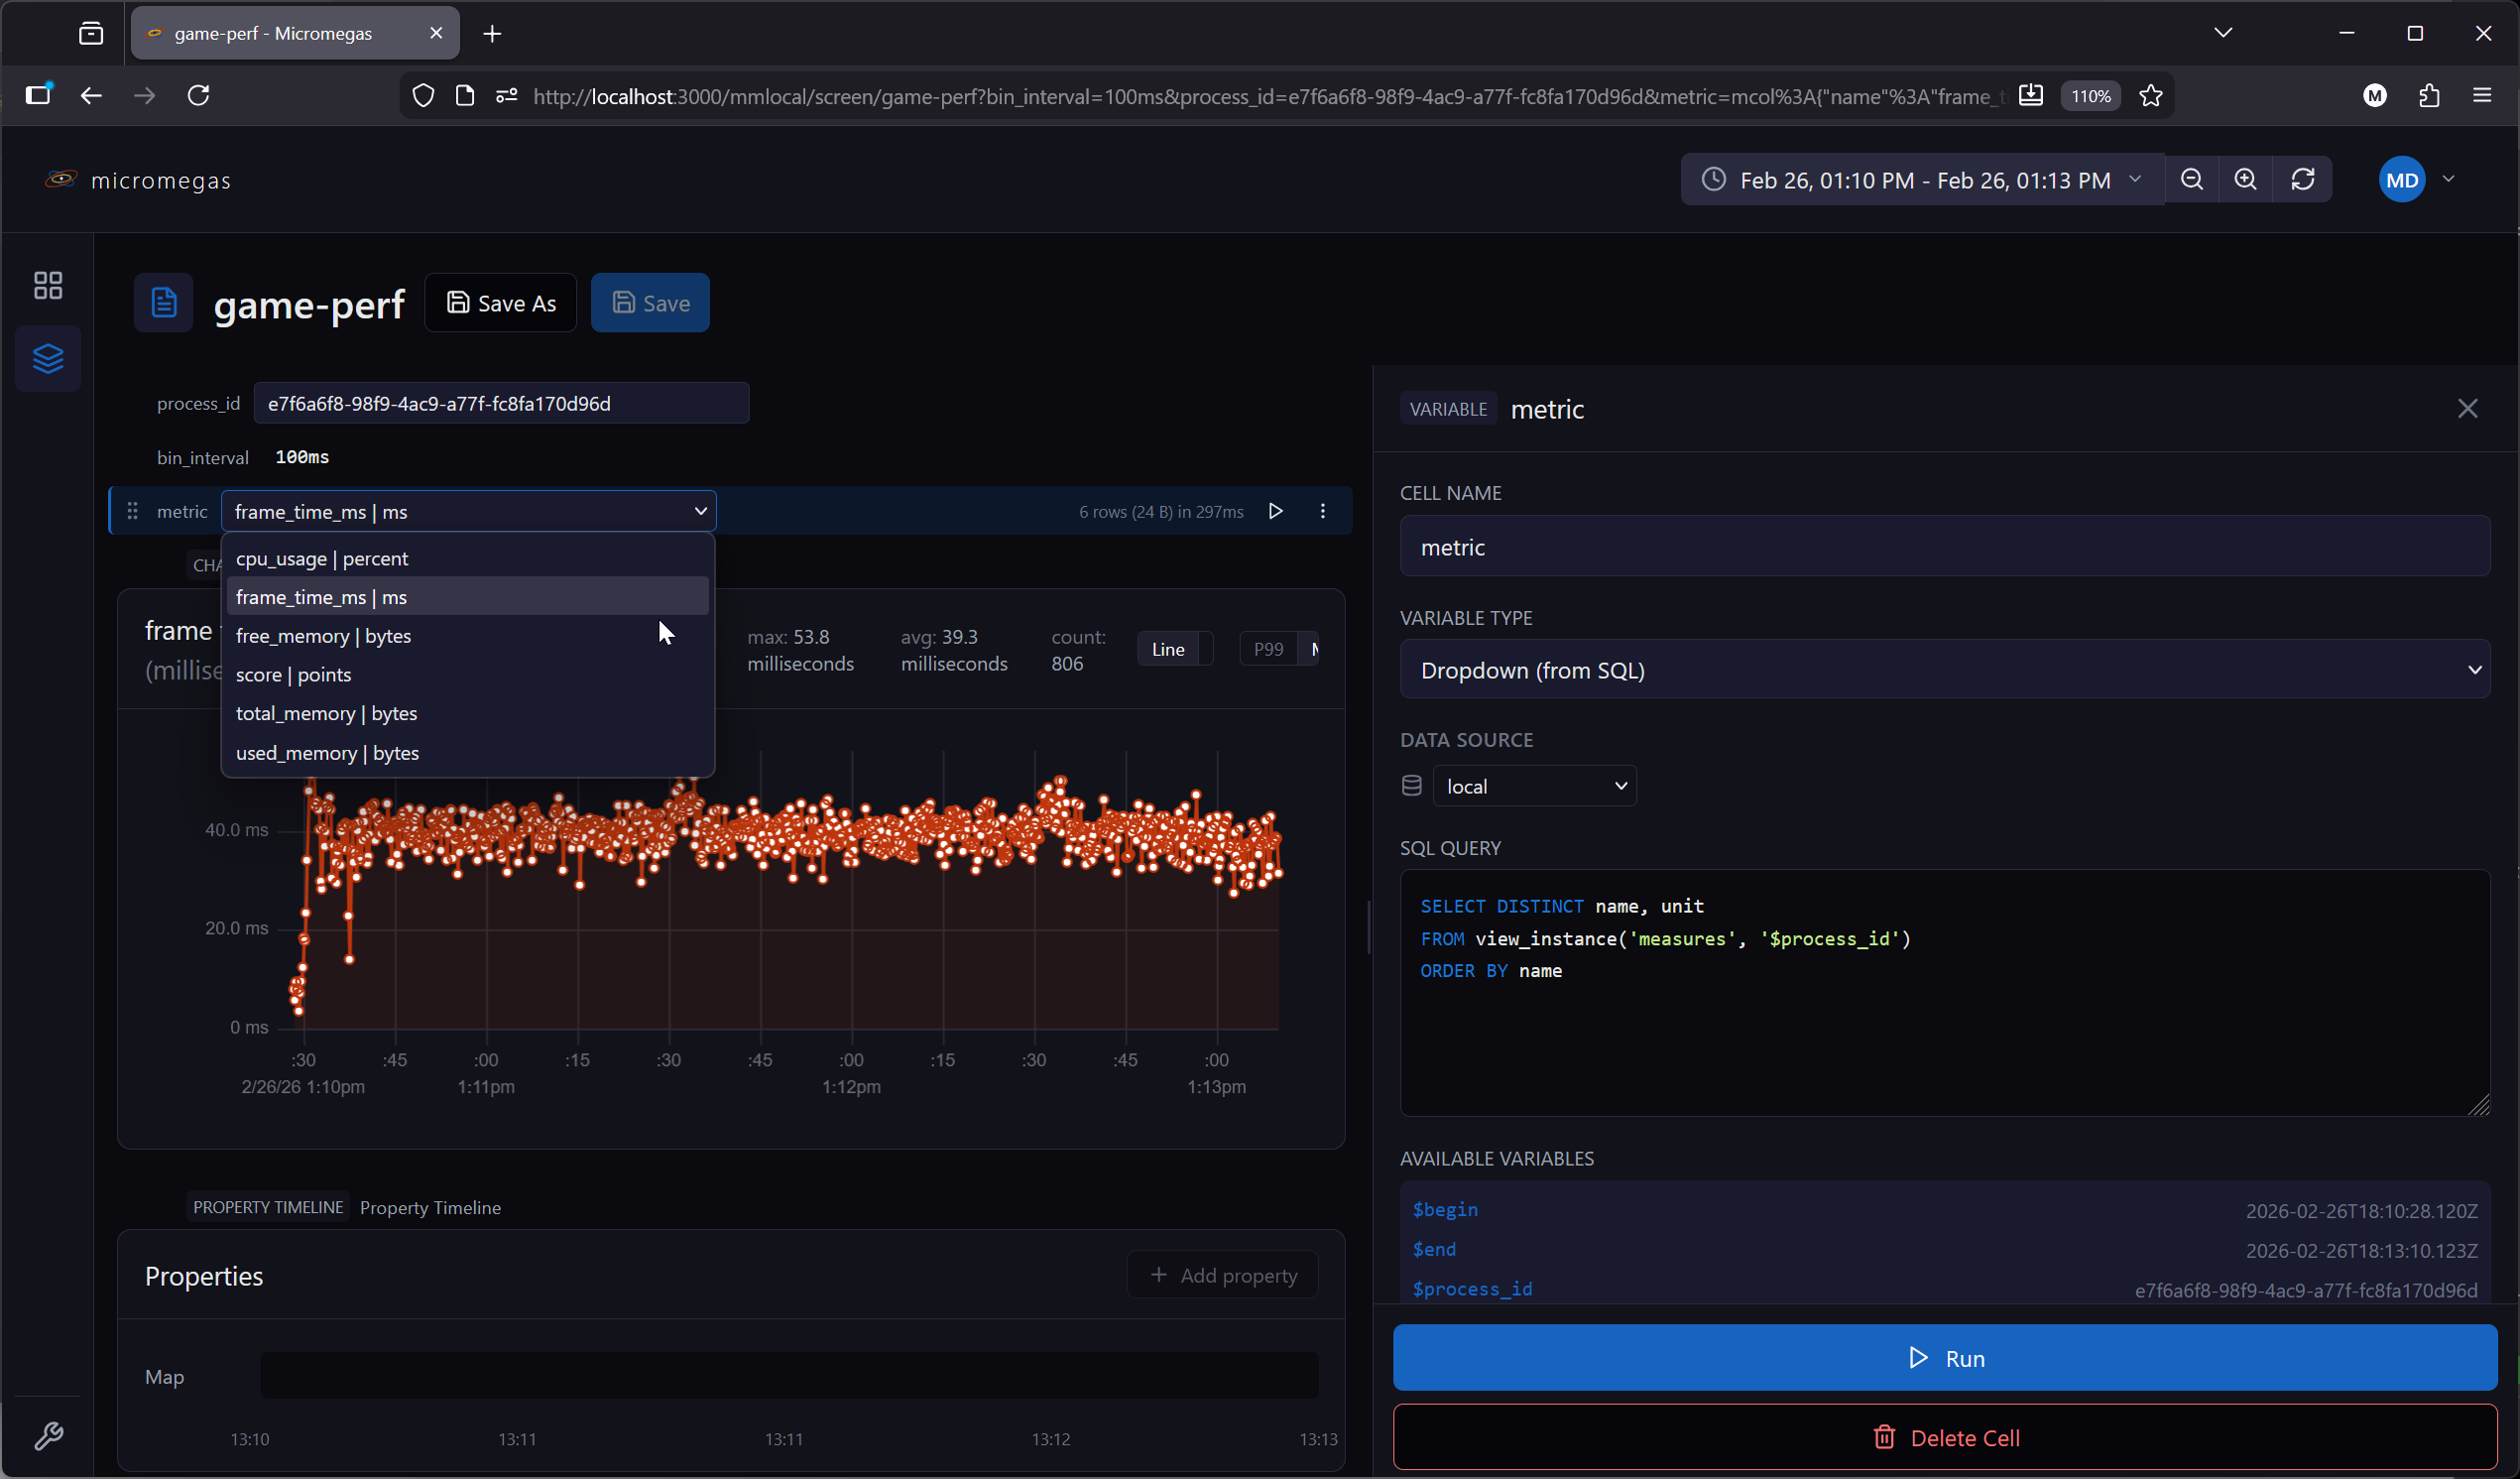
User-configurable inputs that populate $variable references in downstream cells. Variable cells render in the cell title bar rather than taking up vertical space.
There are four variable subtypes, controlled by the variableType field.
Common configuration:
| Field | Type | Description |
|---|---|---|
name |
string | Variable identifier — referenced downstream as $name (or $name.column for multi-column combobox values) |
variableType |
'text' | 'combobox' | 'expression' | 'datasource' |
Variable subtype |
defaultValue |
string or object | Default value used when no URL override is present |
dataSource |
string | Data source for SQL queries (combobox only) |
Variable cells block downstream cells until their value is resolved. See Variables for full documentation of the variable system including scope, expressions, and URL sync.
Text
Free-form text input. The user types a value directly. No SQL execution.
Combobox
Dropdown populated by a SQL query. Single-column queries produce simple string options. Multi-column queries produce options with named fields accessible via $variable.column syntax.
| Field | Type | Description |
|---|---|---|
sql |
string | SQL query returning option values |
dataSource |
string | Data source for the query |
-- Single column: options are strings
SELECT DISTINCT name FROM measures

-- Multi-column: options are objects with .name and .unit fields
SELECT DISTINCT name, unit FROM measures
After execution, the current value is validated against available options. If invalid, the default value or first option is auto-selected.
Expression
Computed value from a JavaScript expression. Evaluated automatically — not user-editable at runtime.
| Field | Type | Description |
|---|---|---|
expression |
string | JavaScript expression to evaluate |
Available bindings: $from, $to, $duration_ms, $innerWidth, $devicePixelRatio, and upstream variables as $variableName.
Allowed operations: arithmetic (+, -, *, /, %), Math.*, new Date(...), and snap_interval(ms). Browser globals (window, document, eval, fetch, …) are blocked.
See Expression Evaluation for details.
Datasource
Dropdown populated with available data sources from the API. Use with $variableName in a query cell's data source field to route queries to user-selected backends.